Moving averages are among the most widely used tools in technical analysis. Traders use them to smooth price fluctuations, identify market trends, and evaluate whether an asset’s price is moving upward, downward, or sideways. They are commonly applied to stocks, indices, commodities, currencies, and other financial instruments.
For beginners, moving averages can make price charts easier to interpret by reducing the impact of short-term fluctuations. However, they are not predictive tools that guarantee profitable trades. Understanding how moving averages work, which types to use, and how to interpret their signals can help traders make more informed decisions.
What Is a Moving Average in Trading?
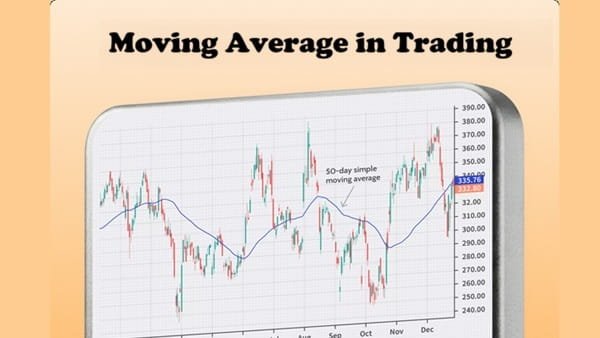
A moving average calculates the average price of an asset over a specified number of periods. As new price data becomes available, the calculation updates, creating a line that moves along the chart.
For example, a 20-day moving average calculates the average closing price over the most recent 20 trading days. When a new trading day ends, the oldest observation is removed and the latest closing price is included.
This process smooths short-term price fluctuations and helps traders focus on the broader direction of the market.
Moving averages are generally plotted directly on price charts. Traders compare the moving average with the current price and with other moving averages to assess trend direction and momentum.
Types of Moving Averages
Simple Moving Average (SMA)
A simple moving average calculates the arithmetic average of prices over a selected period. Every observation within the calculation receives equal weight.
For example, a five-day SMA adds the closing prices of the five most recent trading days and divides the total by five.
The SMA is straightforward to understand and is often used to analyse medium-term or long-term trends. Common examples include the 20-day, 50-day, and 200-day moving averages.
Exponential Moving Average (EMA)
An exponential moving average gives greater weight to recent prices. As a result, it generally responds more quickly to new price movements than an SMA with the same period.
Traders may use shorter EMAs to study short-term momentum and longer EMAs to evaluate broader trends.
However, the EMA’s faster response can also produce more frequent signals during choppy markets. The choice between an SMA and an EMA depends on the trader’s strategy and timeframe.
How Moving Averages Identify Uptrends and Downtrends
One of the simplest uses of a moving average is identifying the general direction of a market.
When a moving average slopes upward, it indicates that the average price over the selected period has generally been increasing. When it slopes downward, it suggests that the average has been declining.
Traders often examine the relationship between price and the moving average as well.
- Potential uptrend: Price remains above a rising moving average.
- Potential downtrend: Price remains below a falling moving average.
- Possible sideways market: Price repeatedly crosses a relatively flat moving average.
These are general observations, not guaranteed trading signals. Prices can temporarily move above or below a moving average without establishing a lasting trend.
Using Multiple Moving Averages
Some traders use two or more moving averages to compare different market timeframes.
For example, a trader might place a 20-day and a 50-day moving average on the same chart. The shorter average responds more quickly to recent price changes, while the longer average generally reflects a broader trend.
If the shorter moving average moves above the longer one, traders may interpret this as a possible bullish signal. If it moves below the longer one, they may interpret it as a possible bearish signal.
These signals are sometimes called moving-average crossovers.
A crossover does not establish that a trend has definitely changed. Moving averages are based on historical prices, so signals can appear after a substantial part of a price movement has already occurred.
Understanding the Golden Cross and Death Cross
Two well-known moving-average signals are the golden cross and the death cross.
A golden cross occurs when a shorter-term moving average crosses above a longer-term moving average. A commonly discussed example is the 50-day moving average crossing above the 200-day moving average. Traders often view this as a potential indication of improving long-term momentum.
A death cross occurs when the shorter-term moving average crosses below the longer-term average. It may indicate weakening momentum or a possible transition toward a downtrend.
Both signals are widely discussed in technical analysis, but neither guarantees that prices will continue in the expected direction. They can also appear relatively late because the averages respond to price movements that have already occurred.
Moving Averages as Dynamic Support and Resistance
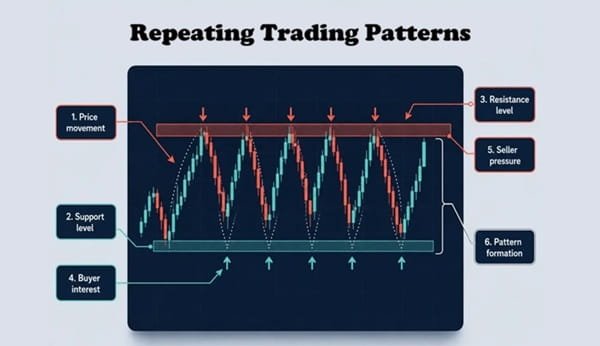
Moving averages are sometimes used as potential dynamic support or resistance levels.
During an uptrend, prices may repeatedly pull back toward a moving average before recovering. Traders may watch these areas for signs that buying interest is returning.
During a downtrend, prices may rise toward a moving average and then fall again as selling pressure resumes.
However, moving averages are not fixed support and resistance levels. Price can move through them, and their significance changes with market conditions.
Traders should therefore avoid assuming that a moving average will automatically prevent a price from falling or rising beyond it.
Choosing the Right Moving Average Period
The appropriate moving-average period depends on the trading strategy.
Shorter averages, such as the 10-day or 20-day moving average, respond quickly to price changes and may suit some short-term strategies. Medium-term traders often examine the 50-day moving average, while longer-term investors may use the 100-day or 200-day average.
There is no universally best period. Shorter averages may generate frequent false signals, while longer averages may react slowly to a genuine change in market direction.
Traders should select periods based on their intended holding period and test their approach rather than choosing settings simply because they are popular.
Limitations of Moving Averages
Moving averages are lagging indicators because they are calculated from historical prices. They cannot predict unexpected news, sudden market shocks, or future price movements with certainty.
They can be particularly misleading in sideways markets, where prices repeatedly cross the average and generate conflicting signals.
For better analysis, traders may combine moving averages with price structure, support and resistance, trading volume, or other indicators. Additional tools should provide useful information rather than create unnecessary complexity.
Risk management remains essential. Traders should define their exit rules and position sizes before entering a trade and avoid relying on a moving-average signal alone.
Conclusion
Moving averages help traders identify market trends by smoothing price fluctuations and highlighting the broader direction of price movements. Simple and exponential moving averages offer different ways to evaluate recent and historical prices, while crossovers can help traders recognise potential changes in momentum.
Nevertheless, moving averages are not guarantees of future performance. Their signals can be delayed or misleading, particularly in volatile or sideways markets.
The most effective approach is to understand what a moving average measures, select a period appropriate to your strategy, test its usefulness, and combine it with disciplined risk management.
Frequently Asked Questions
Q. Which moving average is best for beginners?
A 20-day or 50-day simple moving average can be a useful starting point for studying price trends. The best choice depends on the asset, timeframe, and trading strategy.
Q. What does it mean when the price is above a moving average?
It means the current price is higher than the average price calculated over the selected period. If the average is also rising, this may support the interpretation of an uptrend, but it does not guarantee further gains.
Q. Is an EMA better than an SMA?
Neither is universally better. An EMA responds more quickly to recent prices, while an SMA gives equal weight to observations in its calculation. Traders should compare them based on their specific needs.
Q. What is the difference between a golden cross and a death cross?
A golden cross occurs when a shorter-term moving average crosses above a longer-term average. A death cross occurs when it crosses below the longer-term average.
Q. Can moving averages predict stock prices?
No. They summarise historical price data and help traders assess trends. They cannot reliably predict future prices or eliminate trading risk.
Q. Can moving averages be used for intraday trading?
Yes. Traders can apply moving averages to intraday charts using periods measured in candles rather than days. However, shorter timeframes may generate more noise and false signals, so careful testing and risk management are important.