Candlestick patterns are among the most widely used tools in technical analysis. Traders use them to understand price movements, identify possible changes in market direction, and evaluate the balance between buying and selling pressure. These patterns appear on charts for stocks, indices, currencies, commodities, and other financial instruments.
However, candlestick patterns do not predict the future with certainty. They show how prices behaved during a particular period and can provide clues about market sentiment. To interpret them correctly, traders need to understand what each candle represents, where a pattern appears, and how the surrounding market conditions influence its meaning.
What Is a Candlestick in Trading?
A candlestick represents the price movement of an asset during a specific period, such as one minute, one hour, one day, or one week. Each candle displays four important prices: the opening price, closing price, highest price, and lowest price.
The main part of a candle is called the body. It shows the difference between the opening and closing prices. The thin lines extending above or below the body are called wicks or shadows, which indicate the highest and lowest prices reached during that period.
A bullish candle generally forms when the closing price is higher than the opening price. A bearish candle forms when the closing price is lower than the opening price. Chart colours vary by platform, so traders should check the chart’s settings rather than rely only on colour.
Together, these elements show how prices moved and where the market finished relative to its opening level.
What Candlestick Patterns Reveal About Buying and Selling Pressure
Candlestick patterns help traders interpret the interaction between buyers and sellers. A large bullish candle may indicate strong upward movement during the selected period, while a large bearish candle may reflect strong downward movement.
Long wicks can suggest that prices moved in one direction but failed to maintain those levels. For example, a long upper wick shows that the market reached a higher price but later moved down before the candle closed. This may indicate selling pressure near the high, although the reason for the movement cannot be established from the candle alone.
Similarly, a long lower wick indicates that prices fell before recovering. This can suggest buying interest at lower levels, but it does not guarantee that prices will rise in the next session.
Candlesticks therefore provide evidence about past price behaviour, not certainty about future direction.
Common Candlestick Patterns and Their Meaning
Doji
A doji forms when the opening and closing prices are very close together. It often reflects indecision because the market finishes near where it started despite possible price movement during the period.
A doji appearing after a strong upward or downward trend may alert traders to a possible change in momentum. However, it can also occur during ordinary sideways trading and does not automatically signal a reversal.
Hammer
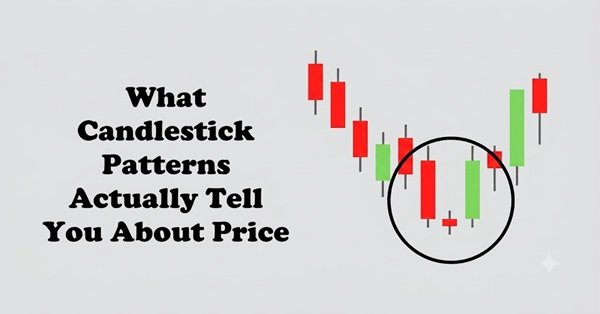
A hammer typically has a small body near the upper part of the candle and a long lower wick. It commonly appears after a decline and may suggest that buyers pushed prices upward after an initial drop.
Traders sometimes interpret it as a potential bullish reversal signal. Its significance depends on the preceding trend, the candle’s location, and what happens next. A hammer in an established downtrend does not guarantee a recovery.
Shooting Star
A shooting star generally has a small body near the lower part of the candle and a long upper wick. It may appear after an upward movement and indicate that buyers were unable to maintain the higher prices reached during the period.
Traders may interpret this pattern as a warning of weakening upward momentum. Confirmation from subsequent price action can help assess whether selling pressure is increasing.
Bullish and Bearish Engulfing Patterns
A bullish engulfing pattern typically consists of a bearish candle followed by a larger bullish candle whose body covers the previous candle’s body. It may suggest that buying pressure has strengthened.
A bearish engulfing pattern is the opposite: a bullish candle is followed by a larger bearish candle whose body covers the previous body’s range. It may indicate increasing selling pressure.
These patterns can be more meaningful when they occur near important support or resistance levels, but they are not reliable in every market environment.
Why the Location of a Pattern Matters
A candlestick pattern should never be interpreted in isolation. Its location on the chart can significantly influence its meaning.
For example, a hammer appearing after a sustained decline may provide a different signal from a similar candle forming in the middle of a sideways market. Likewise, a bearish-looking candle near a resistance level may deserve closer attention if the price has repeatedly struggled to move above that level.
Traders often combine candlestick analysis with trend direction, support and resistance, trading volume, and broader market conditions.
Volume can provide additional context by showing how much trading activity occurred during a price movement. However, high volume does not automatically confirm a reversal, and low volume does not necessarily invalidate a pattern.
How Timeframes Change Candlestick Interpretation
The timeframe determines how much trading activity a candle represents. A five-minute candlestick summarises a short period, while a daily candle captures an entire trading day.
A pattern on a short timeframe may reflect temporary price fluctuations, whereas a similar pattern on a daily or weekly chart may represent a more substantial period of market activity.
Neither timeframe is inherently more accurate. The appropriate choice depends on the trader’s strategy, holding period, and tolerance for short-term price fluctuations.
Traders should also avoid switching between timeframes selectively just to find a pattern that supports an existing opinion.
Limitations of Candlestick Patterns
Candlestick patterns can produce false signals, particularly in choppy markets or during unexpected news events. Different traders may also interpret the same chart differently, and the usefulness of a pattern can vary across instruments and timeframes.
Patterns become especially misleading when traders assume that a familiar shape guarantees a specific outcome. Even a widely recognised bullish pattern can be followed by falling prices.
For a more disciplined approach, traders should define entry conditions, exit rules, position sizes, and acceptable losses before placing a trade. They can test their approach using historical data or simulated trading, while accounting for transaction costs and realistic execution assumptions.
Conclusion
Candlestick patterns provide a visual summary of how prices behaved during a particular period. They can help traders assess buying and selling pressure, recognise possible changes in momentum, and identify areas that deserve further analysis.
However, they do not reveal the future or guarantee profitable trades. Their value comes from combining the information in candle bodies and wicks with trend direction, price levels, volume, and risk management.
Understanding what candlesticks actually show is more useful than memorising pattern names. Traders who interpret them as clues rather than certainties are better positioned to make disciplined decisions.
Frequently Asked Questions
Q. What do candlestick patterns actually tell traders?
They show how prices moved during a selected period, including the opening, closing, highest, and lowest prices. Their shapes can provide clues about buying pressure, selling pressure, and market indecision.
Q. Which candlestick pattern is best for beginners?
The doji, hammer, shooting star, and engulfing patterns are useful starting points. Beginners should learn their structure and limitations rather than assume that any one pattern guarantees a profitable trade.
Q. Do candlestick patterns predict stock prices?
No. They help interpret historical price behaviour and may indicate possible market scenarios, but they cannot reliably predict every future movement.
Q. Are candlestick patterns more reliable with high volume?
Volume can provide useful context, particularly when a price movement occurs alongside unusually strong trading activity. However, high volume alone does not confirm that a pattern will succeed.
Q. Which timeframe is best for candlestick analysis?
It depends on the trading strategy. Short-term traders may examine minute-based charts, while swing traders may prefer hourly or daily charts. Patterns should be evaluated within the broader market context.
Q. Can candlestick patterns be used alone for trading?
They can be studied independently, but relying on them alone may produce misleading signals. Combining them with trend analysis, support and resistance, risk management, and realistic testing can provide a more structured approach.