Financial markets may appear unpredictable, but certain price behaviours occur repeatedly. Traders study these recurring behaviours to understand market trends, identify potential trading opportunities, and manage risk. Common examples include breakouts, pullbacks, support and resistance reactions, trend continuations, and changes in volatility.
However, recognising a familiar pattern does not mean a trader can predict the next price movement with certainty. Patterns are useful only when evaluated in context, tested against historical data, and combined with a clear risk-management plan.
Understanding which trading patterns repeat often enough to deserve attention can help traders focus on meaningful market behaviour instead of reacting to every price movement.
What Are Repeating Trading Patterns?
A trading pattern is a recurring arrangement of price movements, trading activity, or market behaviour. It may develop because of changing supply and demand, investor reactions, trading rules, or the way market participants respond to similar conditions.
Some patterns appear on price charts, while others emerge from statistical analysis of returns, volatility, or trading volume.
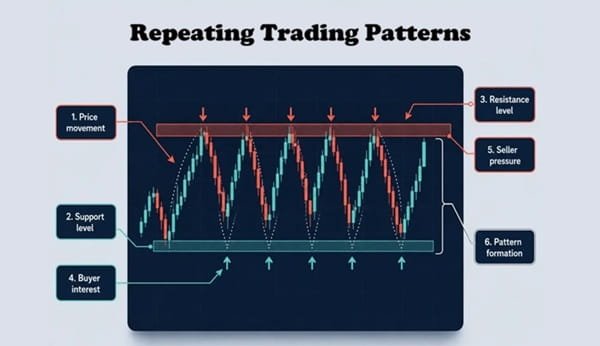
For example, an asset may repeatedly struggle to move above a particular price area. This behaviour could indicate selling pressure, although it does not guarantee that the price will remain below that level.
Patterns can be observed across stocks, indices, commodities, currencies, and derivatives. Their usefulness varies by instrument, timeframe, market conditions, and trading costs.
Trend Continuation Patterns
One of the most widely studied market behaviours is trend continuation. During an uptrend, prices often form higher highs and higher lows. During a downtrend, they tend to form lower highs and lower lows.
Markets do not move in straight lines. Even a strong trend can include temporary pullbacks, pauses, and periods of consolidation before the broader movement continues.
Traders study these pauses to assess whether the existing trend remains intact or is beginning to weaken. For instance, a stock may rise, retrace part of its advance, and then move higher again.
Trend continuation is not guaranteed. A pullback can develop into a reversal, so traders often examine price structure, trading volume, and predefined exit conditions before taking a position.
Support and Resistance Reactions
Support and resistance are price areas where markets have previously experienced buying or selling pressure.
Support is an area where a falling price has previously stabilised or rebounded. Resistance is an area where a rising price has previously struggled to advance.
These areas matter because market participants may remember previous turning points, place orders around familiar levels, or react to changes in supply and demand.
When a price approaches support, traders may watch for signs of stabilisation. Near resistance, they may look for evidence that upward momentum is weakening.
However, support and resistance are not fixed barriers. Prices can break through them, briefly move beyond them, or reverse before reaching them. Traders should treat these levels as zones of interest rather than guaranteed turning points.
Breakouts and Failed Breakouts
A breakout occurs when an asset moves beyond an established trading range or an important price level. Traders often monitor breakouts because they may signal a change in market conditions or the beginning of a stronger price movement.
For example, a stock that trades within a narrow range for several sessions may eventually move above the range’s upper boundary. If buying interest continues, the price may establish a new upward trend.
However, some breakouts fail. The price may move above resistance and then quickly fall back into the previous range. Such movements are often called false or failed breakouts.
Traders sometimes examine volume, closing prices, and subsequent price action to assess whether a breakout is gaining acceptance. No confirmation method eliminates the risk of failure.
Mean Reversion and Price Extremes
Mean reversion refers to the tendency of some prices or statistical measures to move back toward a historical average or typical range under certain conditions.
For example, a stock may move sharply away from its recent average and later return closer to it. Traders may investigate whether such movements occur frequently enough to support a strategy.
Mean reversion is not a universal market rule. A price that appears unusually high or low can continue moving in the same direction, especially when new information changes the asset’s perceived value.
A strategy based on mean reversion should therefore be tested carefully. Traders need to distinguish temporary deviations from genuine changes in market conditions.
Volatility Expansion and Contraction
Markets often alternate between relatively quiet periods and periods of increased price movement. Volatility contraction occurs when price fluctuations become smaller, while volatility expansion describes a period of larger movements.
A narrow trading range may precede a significant price move, but the direction cannot be reliably determined from contraction alone. The eventual movement may be upward or downward, and some quiet periods end without a substantial breakout.
Traders monitor volatility because it affects stop-loss distances, position sizing, and the amount of risk associated with a trade. A strategy suitable for a calm market may perform poorly during sudden volatility.
Recurring Time-Based Patterns
Some traders investigate whether prices behave differently at particular times of day, around market openings and closings, or during certain calendar periods.
For example, market openings can involve adjustments to information released outside regular trading hours. Economic announcements and scheduled corporate results can also affect trading activity and volatility.
Seasonal patterns may appear in historical data, but they are not necessarily stable or profitable after transaction costs. A pattern observed over a limited period may reflect chance rather than a repeatable advantage.
Time-based strategies require sufficiently broad data, careful testing, and consideration of changes in market structure.
How to Determine Whether a Pattern Matters
A pattern deserves attention only when there is evidence that it may provide useful information. Traders should avoid relying solely on chart shapes or memorable examples.
A disciplined evaluation includes several steps:
- Define the pattern clearly: Establish objective rules for when it begins, what confirms it, and when it ends.
- Test historical data: Examine many occurrences rather than selecting only successful examples.
- Include realistic costs: Account for brokerage, spreads, slippage, and other relevant expenses.
- Test different conditions: Check whether the pattern works across different periods and market environments.
- Manage risk: Set position sizes and exit rules before entering a trade.
It is also important to avoid overfitting, which occurs when a strategy is adjusted so extensively to historical data that it performs poorly on new data.
Conclusion
Several trading behaviours occur often enough to deserve study, including trend continuation, support and resistance reactions, breakouts, mean reversion, and changes in volatility. These patterns can help traders organise market information and develop structured strategies.
Nevertheless, recurring behaviour is not the same as a reliable prediction. Every pattern can fail, and its usefulness depends on the instrument, timeframe, market environment, and trading costs.
The most effective approach is to define patterns objectively, test them with realistic assumptions, and use disciplined risk management. Traders should focus on evidence rather than assuming that a familiar chart shape guarantees a profitable outcome.
Frequently Asked Questions
Q. Which trading patterns occur most often?
Trends, pullbacks, support and resistance reactions, consolidations, breakouts, and changes in volatility are commonly observed. Their frequency and usefulness vary across markets and timeframes.
Q. Do trading patterns guarantee profits?
No. Patterns describe recurring behaviour, not certain future outcomes. Even a strategy with a historical advantage can experience losing trades and extended periods of poor performance.
Q. Which trading patterns are best for beginners to study?
Beginners can start with trend continuation, support and resistance, and breakouts. These concepts help explain price structure without requiring complex mathematical models.
Q. How can traders test whether a pattern works?
They can define objective rules, analyse historical examples, include realistic transaction costs, and test the strategy on data that was not used to develop it. Simulated performance still does not guarantee future results.
Q. Are candlestick patterns more reliable than price trends?
Neither is universally more reliable. Candlestick patterns describe price behaviour over specific periods, while trend analysis focuses on broader price structure. Their usefulness depends on context and testing.
Q. Can AI identify repeating trading patterns?
AI and statistical models can analyse large datasets and identify potential relationships. However, models can discover misleading patterns, overfit historical data, or fail when market conditions change. Independent validation and risk controls remain essential.