Gold has long been considered an important asset for investors seeking portfolio diversification and a potential store of value. However, gold prices fluctuate because of changes in interest rates, currency movements, inflation expectations, geopolitical developments, and global demand. Before investing in gold or trading gold-related instruments, understanding how to read a gold trading chart can help you interpret price movements and make more informed decisions.
A gold chart displays historical price behaviour over a selected period. By examining trends, support and resistance, candlesticks, and trading volume where available, investors can better understand market conditions. However, charts cannot guarantee future returns, and technical analysis should be combined with an understanding of investment objectives and risk.

Understand What a Gold Trading Chart Shows
A gold trading chart displays the price of gold over time. Depending on the platform, it may show international spot gold, gold futures, or a gold-related financial product.
Before analysing a chart, identify exactly what you are viewing. International spot gold is commonly quoted in US dollars per troy ounce, while Indian gold prices are often discussed in rupees per 10 grams. MCX gold futures have their own contract specifications, including expiry dates and lot sizes.
These prices are related but are not identical. International prices, the USD/INR exchange rate, domestic taxes, import costs, and futures pricing can all affect the price observed in India.
The horizontal axis usually represents time, while the vertical axis represents price. Understanding the instrument, currency, unit, and timeframe is the first step toward interpreting the chart correctly.
Choose the Right Chart Type
Gold trading platforms generally offer several chart types.
Line chart: A line chart connects prices, often closing prices, across time. It is useful for identifying the overall direction of gold prices without being distracted by short-term fluctuations.
Candlestick chart: Each candlestick shows the opening, closing, highest, and lowest prices during a selected period. It helps traders examine price movements in greater detail.
Bar chart: A bar chart also displays opening, closing, high, and low prices but uses a different visual format.
Beginners can start with a line chart to understand the broad trend and then use candlestick charts to study individual trading sessions.
Identify the Overall Gold Price Trend
One of the most important steps is determining whether gold prices are moving upward, downward, or sideways.
An uptrend generally forms when prices make higher highs and higher lows. This suggests that buyers have been willing to purchase gold at progressively higher prices.
A downtrend generally features lower highs and lower lows, indicating that prices are weakening over the selected period.
A sideways market occurs when gold fluctuates within a relatively limited range without establishing a clear direction.
The timeframe matters. Gold may be rising on a daily chart while experiencing a short-term decline on an hourly chart. Long-term investors should therefore avoid basing an investment decision entirely on a short-term price movement.
Read Gold Candlesticks for Price Behaviour
Candlesticks help explain how gold prices behaved during a particular period.
A bullish candle closes above its opening price, while a bearish candle closes below it. The candle’s body shows the difference between the opening and closing prices, and its wicks indicate the highest and lowest prices reached.
A large bullish candle may indicate strong upward movement during the session. A long upper wick can suggest that gold reached a higher price but later declined before the session ended. A long lower wick may indicate that prices recovered after falling.
These observations provide clues about buying and selling pressure, but they do not guarantee what happens next.
Patterns such as hammers, dojis, and engulfing candles may attract traders’ attention, particularly near important price levels. However, their meaning depends on the broader trend and subsequent price behaviour.
Understand Support and Resistance Levels
Support and resistance are price areas where gold has previously experienced buying or selling pressure.
Support is an area where a falling gold price has previously stabilised or rebounded. Resistance is an area where a rising price has struggled to move higher.
For example, if gold repeatedly rebounds near a particular price, investors may monitor that area as potential support. If gold repeatedly falls after approaching another level, that area may act as resistance.
These levels are not fixed barriers. Gold prices can break through them when market conditions change, and previous support may later become resistance. Treat them as zones for analysis rather than guaranteed turning points.
Use Moving Averages to Understand Gold Trends
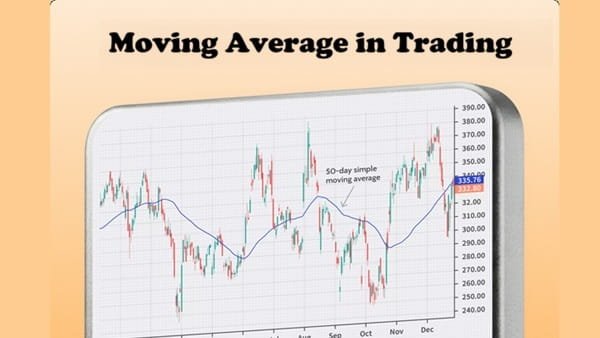
Moving averages smooth price fluctuations and help investors assess the direction of gold prices over time.
A 20-day moving average reflects the average price over a relatively short period, while 50-day and 200-day moving averages are often used to examine medium-term and longer-term trends.
When gold trades above a rising moving average, it may indicate that the broader price trend is positive. Trading below a falling moving average may suggest weakening prices.
Some traders also monitor moving-average crossovers to identify possible changes in momentum. However, these indicators are based on historical prices and may generate delayed or misleading signals.
Consider Trading Volume and Market Conditions
Volume shows how much trading activity occurred during a particular period. On gold futures charts, higher volume can indicate greater participation in the market.
A price breakout accompanied by increased volume may provide additional evidence that market participants are responding to the move. Nevertheless, volume alone cannot confirm that a trend will continue.
Gold prices are also influenced by factors that a chart cannot fully explain, including US interest-rate expectations, inflation data, central-bank purchases, geopolitical tensions, and changes in the US dollar.
Indian investors should pay particular attention to the USD/INR exchange rate. Even if international gold prices remain unchanged, a weaker rupee can increase domestic gold prices, while a stronger rupee can have the opposite effect, all else being equal.
Match Chart Analysis to Your Investment Goal
The way you read a gold chart should depend on why you want to invest.
Long-term investors may focus on broader price trends and use charts as one part of their overall asset-allocation decisions. Short-term traders may examine candlestick patterns, support and resistance, and intraday price movements.
Gold ETFs, physical gold, and MCX gold futures also involve different costs and risks. Physical gold may involve making charges and storage considerations, while ETFs have fund-related expenses and market-price fluctuations. Futures involve expiry dates, margin requirements, and leverage-related risks.
Do not assume that a favourable chart pattern makes every gold investment product suitable for you.
Conclusion
Reading a gold trading chart involves understanding the instrument, identifying the overall trend, interpreting candlesticks, marking support and resistance, and evaluating moving averages and volume. These tools can help you understand historical price behaviour and assess possible market scenarios.
However, no chart pattern can guarantee that gold prices will rise or fall. Combine technical analysis with an understanding of economic developments, currency movements, investment costs, and your financial goals. Most importantly, avoid investing money solely because a chart appears bullish.
Frequently Asked Questions
Q. Which chart is best for analysing gold prices?
A line chart is useful for identifying broad trends, while candlestick charts provide more detail about opening, closing, high, and low prices. The best choice depends on your investment timeframe and analytical needs.
Q. How can I tell whether gold prices are rising or falling?
Look for higher highs and higher lows to identify a potential uptrend, or lower highs and lower lows to identify a potential downtrend. Confirm your observations over an appropriate timeframe.
Q. Which indicators are useful for gold trading?
Moving averages, support and resistance levels, and volume can provide useful context. No indicator is reliable in every market condition, so avoid relying on a single signal.
Q. Do gold charts predict future prices accurately?
No. Charts help interpret past price behaviour and possible trends, but unexpected economic announcements, currency movements, and geopolitical events can change prices quickly.
Q. Should beginners use gold charts before investing?
Yes. Learning to read charts can help beginners understand price fluctuations and avoid making decisions based solely on recent headlines. However, chart analysis should complement, not replace, research into costs, risks, and investment goals.
Q. Is MCX gold trading the same as investing in physical gold?
No. MCX gold futures are derivative contracts with expiry dates and margin requirements. Physical gold involves buying the metal itself and may include making charges, storage costs, and other expenses. Understand the product before investing or trading.